There are three parts to today’s lab. Each part deals with a different aspect of binary signal analysis.
Part 1: Decode a 4-letter word from a binary signal
The animated gif image below contains a binary signal, that has a short message encoded in it:

The message encoded in the signal is a 4-letter word. Using a phototransistor and an Arduino, the signal can be recorded and plotted on the screen so that the message can be decoded.

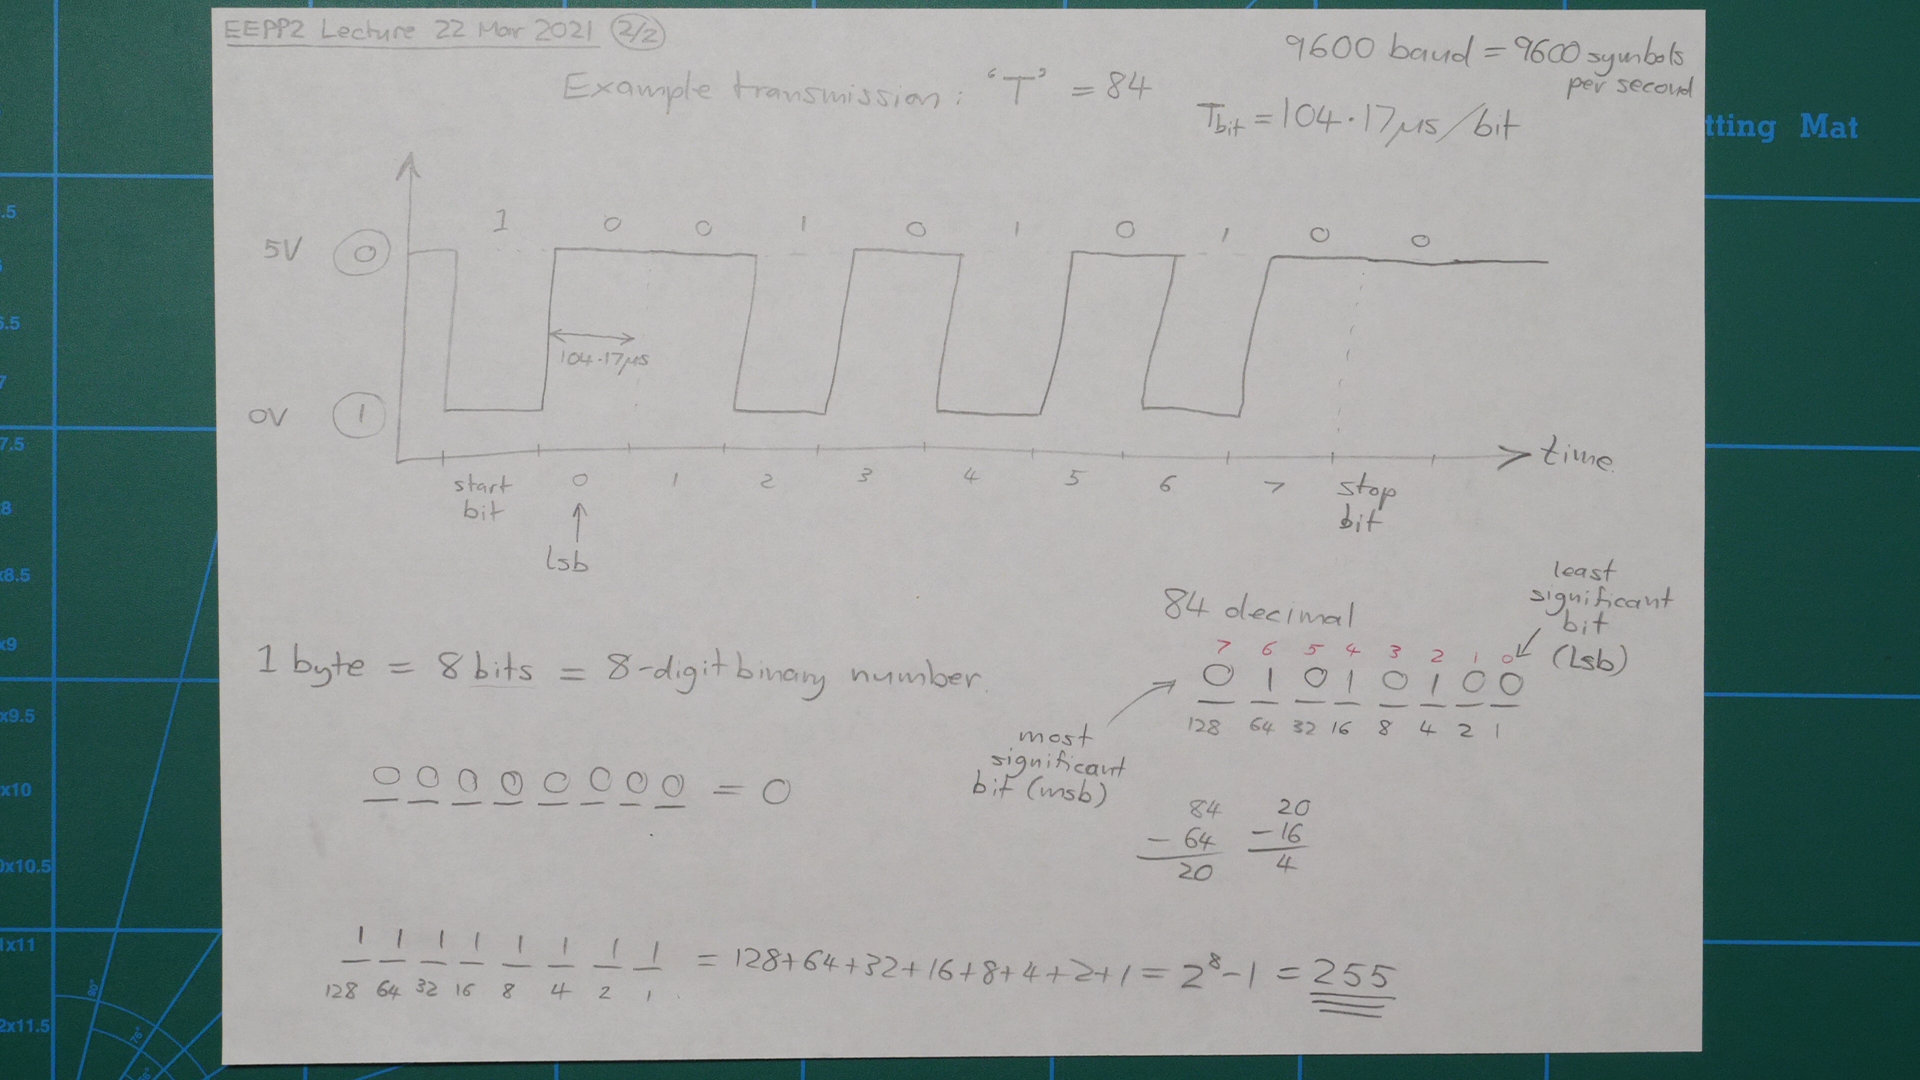
Each byte is preceded by a start bit (1).
Each byte is followed by a stop bit (0).
Bytes are transmitted least significant bit (lsb) first.
Each byte represents one text character using UTF-8 / ASCII encoding.
Each byte represents one character of text using UTF-8 / ASCII encoding. Tables of UTF-8 / ASCII character values are widely available online, such as this one on Wikipedia. The 4-letter key word encoded in the example signal shown above is “Demo”.
The list below includes an animated gif file for each student in the class. A unique 4-letter key word is encoded into each gif file. Your instructor will tell you which gif is assigned to you. Your goal is to use your Arduino (with a TCRT5000) to record and plot the binary signal encoded in your gif and then decode it to reveal your 4-letter key word. Once you find your keyword, submit it to the Brightspace assignment set up for today’s lab.
- 01.gif
- 02.gif
- 03.gif
- 04.gif
- 05.gif
- 06.gif
- 07.gif
- 08.gif
- 09.gif
- 10.gif
- 11.gif
- 12.gif
- 13.gif
- 14.gif
- 15.gif
- 16.gif
- 17.gif
- 18.gif
- 19.gif
- 20.gif
- 21.gif
- 22.gif
- 23.gif
- 24.gif
- 25.gif
The circuit shown below can be used to convert the optical signal into a voltage signal and then record it using an Arduino.

The following Arduino program samples the analog voltage on pin A0 every 10 ms and prints the value (in digital units) via the serial connection. This allows the signal to be displayed on the screen using the Serial Monitor or Serial Plotter in the Arduino IDE.
//
// optoscope.ino - written by Ted Burke - 23 Mar 2021
// This program measures the analog voltage on pin A0
// every 10ms and prints the value in digital units.
//

void setup()
{
  // Open serial connection at 115200 baud
  Serial.begin(115200);
}

void loop()
{
  unsigned long t_next; // next sample time

  t_next = micros(); // initialise sample time

  while(1)
  {
    // Wait 10000us between samples
    t_next = t_next + 10000L;
    while(micros() < t_next);

    // Print a sample from pin A0
    Serial.println(analogRead(0));
  }
}
If the Serial Monitor is used, the signal appears as a list of numbers that can be copied and pasted into a CSV file, and then be loaded into Octave / MATLAB and plotted for detailed analysis. If the signal is contained in a CSV file called “data.csv” then the following Octave commands can be used to load and plot the data:
data = csvread('data.csv');
plot(data);
SUBMISSION ITEM 1: Submit your 4-letter key word to Brightspace.
If you have problems getting a signal from your screen in Part 1: Workaround for TCRT5000
It has emerged that some of the TCRT5000s in the student kits do not respond at all to the visible light emitted by computer/phone screens. If the signal measured by your circuit responds well when you hold a TV remote against it and press and button, or when you move your hand over it to block the daylight (which contains IR light), but it does not respond at all when you hold it up to the flashing gif on the screen, then your circuit is probably wired correctly, but you have one of these problematic TCRT5000 sensors. It’s worth nothing that this is not actually a fault with your TCRT5000 – we’re using this component to sense something it wasn’t designed to sense (visible light).
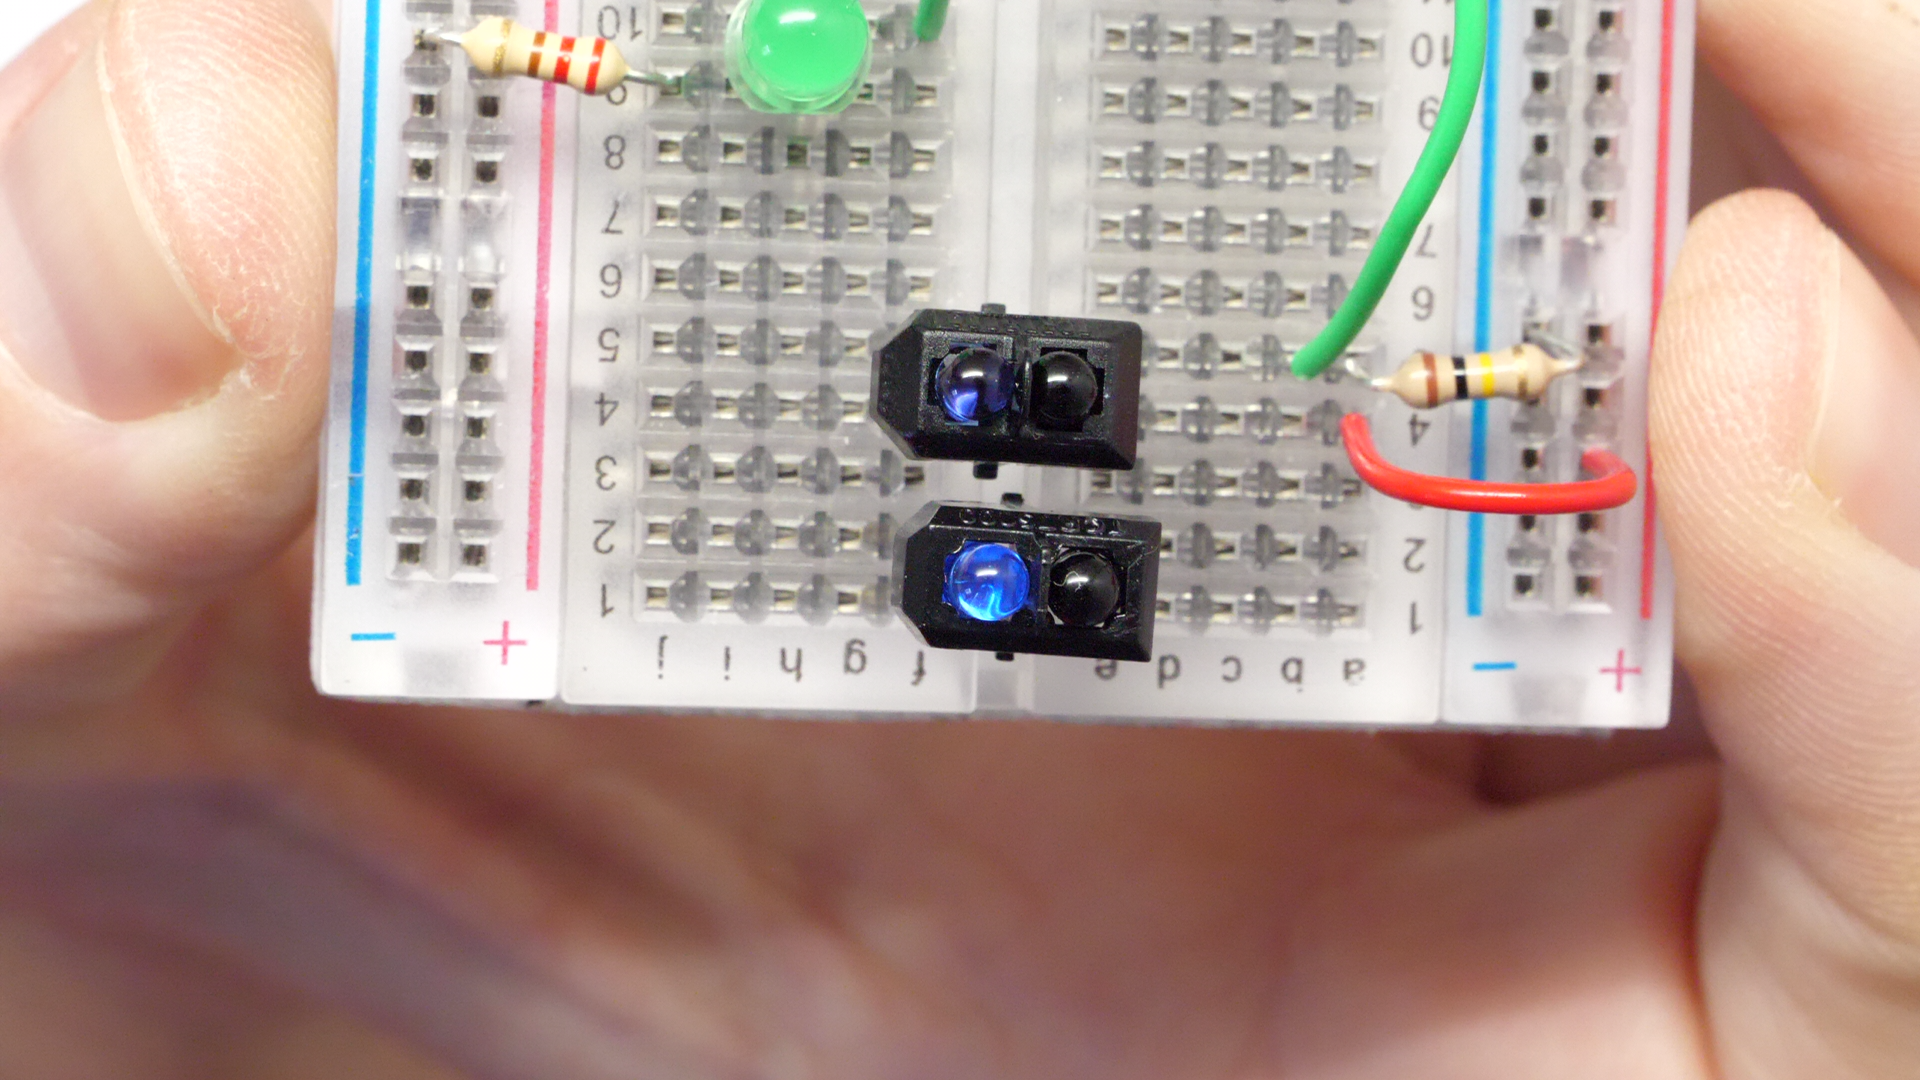
Anyway, the first possible workaround is to try a different TCRT5000, because some of the ones in the kits work perfectly as described in Part 1. The photo below shows two TCRT5000s, one which responds to light from the screen (the bottom one) and one which does not (the top one). As you can see, the one that responds to the screen has a paler “blue eye” (the LED).
The second workaround is to rewire your circuit as shown below, so that the LED is actually emitting IR light and the sensor detects how much of it is reflected from the screen. This is different from what was described in Part 1, because in that case the sensor was sensing light that was emitted from the screen rather than reflected off it.

Using this workaround, the signal will not appear as strong as it would using the original method described in Part 1. With care though, it should be possible to obtain a clear signal. You may need to adjust the angle very carefully to get a good response. The TCRT5000 should be pressed right up against the screen. In this case, it actually seems to work better if you hold it at a slight angle (20 or 30 degrees) rather than pointing straight into the screen. The flashing gif below can be used for testing, together with the Serial Plotter in the Arduino IDE. The waveform below shows what kind of response you can hope to see when you have the sensor positioned correctly.


Part 2: Record a binary signal from an infrared remote control
Most TV remote controls use pulses of infrared light to transmit information to the appliances they control. These infrared pulses form a binary signal and each button produces a different series of ones and zeros. Different manufacturers use different communication protocols.
Try to capture a clear plot of the binary signal produced by your remote control. The figure below shows an example binary signal captured from a Panasonic TV remote control. Each of the pulses visible below actually consists of a short burst of some carrier frequency (normally around 38 kHz). Hence, if you zoom in very close, you may notice that the pulses aren’t completely solid.

The binary signals produced by a remote control are a lot faster than the (very slow) signal you decoded in Part 1. To capture the fast-changing detail in the remote control signal, some changes to the Arduino circuit are required, as shown below. The resistor value is reduced to 1 kΩ and the signal is sampled through a digital input pin rather than an analog input.

The Arduino program shown below waits until a rising edge is detected on digital input pin D3. As soon as a rising edge is detected, the Arduino captures 10000 samples of the binary signal at a sampling rate of 100 kHz. The samples are stored to a memory buffer during recording, then printed out via the serial connection once recording is complete. (EDIT 13-Apr-2021: Added a line to reset the data buffer to all zeros before capturing each transmission, which ensures that none of the previous transmission’s samples remain in the buffer.)
//
// Remote control binary signal capture example code
// Written by Ted Burke - last updated 13-Apr-2021
//

unsigned char data[1250];  // 1250-byte buffer to store 10000 bits
unsigned int n = 0;        // sample counter

void setup()
{
  Serial.begin(115200);    // open serial connection
}

void loop()
{
  for(n=0 ; n<1250 ; ++n) data[n] = 0; // reset data buffer to all zeros

  while(!digitalRead(3));  // wait for start of transmission

  // Record 10000 samples into the data buffer
  for(n=0 ; n<10000 ; ++n)
  {
    // Record a 1-bit sample from pin D3 into the buffer
    // Eight samples get packed into each byte in the buffer
    data[n/8] += digitalRead(3) << (n%8);

    // Precise delay to get very close to 100 kHz sampling
    delayMicroseconds(3);
    __asm__("nop\n\tnop\n\t"); // tiny delay!
  }

  // Print out the stored samples
  for(n=0 ; n<10000 ; ++n) Serial.println((data[n/8] >> (n%8)) & 1);

  delay(500);
}
The signal can be copied and pasted from the Serial Monitor into a CSV file and then loaded into Octave/MATLAB for plotting and analysis (see example Octave commands in Part 1).
- Try plotting the signals for different buttons on your remote control. Can you see how the signal changes for different buttons?
- Search online for information about the communication protocol used by your remote control. Can you find a matching protocol online?
- How are ones and zeros represented in the signal emitted by your remote control?
SUBMISSION ITEM 2: If you captured clear signals from your remote control, then paste some example plots into a Word document and submit it to the Brightspace assignment. If you tracked down any information online about the protocol used by your remote control, include that information in the Word document (a summary and/or links to the information online).
Part 3 (advanced): Program the Arduino to respond to the remote control
Once you have established how your remote control encodes each of its buttons, try to write an Arduino program that prints two different messages (via the Serial Monitor) when two different buttons are pressed on the remote control.
Note that this is much more difficult than the tasks in Parts 1 and 2. If you’re not sure where to start, discuss it with your lab instructor. The solution will be different for each remote control, because it will depend on the signal encoding used. Here are some ideas to get you started:
- A good place to start is to get the Arduino to respond to any button.
- If you only need to tell the difference between two buttons, then look for any single point that’s different in the two signals and focus on that. Measure the time delay from the start of the message to that point in the signal. If you check the signal level at that exact time, you should be able to determine which of the two signals it is.
- Try discussing the problem with you classmates and your lab instructors.
SUBMISSION ITEM 3: If you get this part working, record a short video showing the Arduino responding to each button and submit it via Brightspace. Please upload your “.ino” file also.
Appendix: Some useful / interesting information
Notes from yesterday’s lecture:

In case you’re curious how those binary signal gifs were generated…
The following C program creates two PGM images, “0.pgm” and “1.pgm”, that are used as frames in the generated gif animations. Each image is 100 x 100 px. “0.pgm” is all white. “1.pgm” is all black.
//
// make_bw_frames.c - written by Ted Burke - 22 Mar 2021
// Make black and white frames for creating binary signal gifs
//
// To convert frames to gif using ImageMagick:
//
//      convert -delay 25 -loop 0 *.pgm flash.gif
//

#include <stdio.h>

// Image height and width in pixels
#define H 100
#define W 100

void print_pgm(FILE *f, int h, int w, int n);

int main()
{
    FILE *f;

    // Write a white square to a PGM file
    f = fopen("0.pgm", "w");
    print_pgm(f, H, W, 255);
    fclose(f);

    // Write a black square to a PGM file
    f = fopen("1.pgm", "w");
    print_pgm(f, H, W, 0);
    fclose(f);
}

void print_pgm(FILE *f, int h, int w, int n)
{
    int x, y;

    // Print the contents of a PGM file containing
    // a solid rectangle of the specified width,
    // height and pixel value
    fprintf(f, "P2\n%d %d\n255\n", w, h);
    for (y=0 ; y<h ; ++y)
    {
        for (x=0 ; x<w ; ++x)
        {
            // Print pixel value
            fprintf(f, "%03d ", n);
        }
        fprintf(f, "\n");
    }
}
A file similar to the one shown below called “keys_list.txt” must then be provided. A gif file will be created for each line.
01	Blip
02	dark
03	SHOE
04	Harp
...
The following program reads the keys and numbers from “keys_list.txt” and generates an animated gif file for each line. It uses ImageMagick’s convert utility to create each gif. Two frame images – “0.pgm” and “1.pgm” – must be present in the same folder – one being a plain black image and the other being a plain white image.
//
// make_gifs.c - written by Ted Burke - 23 Mar 2021
//
//    gcc make_gifs.c -o make_gifs
//

#include <stdio.h>
#include <string.h>
#include <stdlib.h>

int main()
{
    int i, j, n, number;
    char key[10];

    // Buffer to store ImageMagick command for creating each gif
    char command[2000];

    FILE *f = fopen("keys_list.txt", "r");

    for (n=1 ; n<=26 ; ++n) // create 26 gif files
    {
        // Read gif number and key word from keys_list.txt
        fscanf(f, "%d %s", &number, key);

        // Construct ImageMagick command to create gif animation
        sprintf(command, "convert -delay 25 -loop 0 ");

        // Add one frame to animation for each bit (40 frames in total)
        for (i=0 ; i<4 ; ++i) // 4 bytes
        {
            sprintf(command + strlen(command), "1.pgm ");  // start bit
            for (j=0 ; j<8 ; ++j) // 8 bits in each byte
            {
                // next data bit
                if ((key[i] >> j) & 1) sprintf(command + strlen(command), "1.pgm ");
                else sprintf(command + strlen(command), "0.pgm ");
            }
            sprintf(command + strlen(command), "0.pgm "); // stop bit
        }

        // Leave a long gap (40 frames) before next transmission
        for (i=0 ; i<40 ; ++i) sprintf(command + strlen(command), "0.pgm ");

        // Complete the ImageMagick command by adding output filename
        sprintf(command + strlen(command), "%02d.gif\n", number);

        //printf("\n%s\n", command);

        // Execute ImageMagick command to create gif
        system(command);
    }

    fclose(f);

    return 0;
}
The following Arduino program was used to measure the sampling rate when recording the remote control signal.
//
// Remote control binary signal capture example code
// Written by Ted Burke - 23-Mar-2021
//

const unsigned int N=10000;
unsigned char data[1250];  // 1250-byte buffer to store 10000 bits
unsigned int n = 0;        // sample counter

void setup()
{
  Serial.begin(115200);    // open serial connection
}

void loop()
{
  unsigned long t1, t2, t; // used to calculate elapsed time

  while(!digitalRead(3));  // wait for start of transmission
  t1 = micros();           // remember time before sampling

  // Record 10000 samples into the data buffer
  for(n=0 ; n<N ; ++n)
  {
    // Record a sample from pin D3 into the buffer
    data[n/8] += digitalRead(3) << n%8;

    // Precise delay to get very close to 100 kHz sampling
    delayMicroseconds(3);
    __asm__("nop\n\tnop\n\tnop\n\tnop\n\t");
  }

  t2 = micros();
  t = t2 - t1;
  //Serial.print(t); Serial.println(" us");
  //Serial.print(N/(t*1e-6), 5); Serial.println(" Hz");
  //Serial.print(t/(float)N); Serial.println(" us/sample");

  // Print out stored samples
  if (1) for(n=0 ; n<N ; ++n) Serial.println((data[n/8] >> (n%8)) & 1);
}
