In this experiment, you will investigate a series of AC circuits using two different approaches:
- Phasor analysis using Octave / MATLAB,
- Circuit simulation in LTspice.
You’ll install LTspice and Octave, then use them both to analyse each circuit.
There are seven submission items in total, each of which should be uploaded to the Brightspace assignment for today’s lab. Each item is either a screenshot or an m-file (a MATLAB/Octave program).
Install LTspice and Octave
LTspice is free circuit simulation software distributed by the semiconductor company Analog Devices. It’s one of a number of circuit simulation tools based on the open source circuit simulator SPICE, which was first released almost 50 years ago. LTspice can be downloaded here:
https://www.analog.com/en/design-center/design-tools-and-calculators/ltspice-simulator.html#
Scroll down to the “Download LTspice” section and click on “Download for Windows 7, 8 and 10“. Run the downloaded file to install LTspice on your machine.
MATLAB is a programming and numerical computing environment that is widely used by engineers to process and analyse signals and data. MATLAB is proprietary software, and purchasing a full license is very expensive. However, it’s an extremely powerful tool and many engineers spend a large part of their professional life working in it, so companies are willing to pay to use it. As a TU Dublin student, you can access MATLAB for free, but there are also a number of free software alternatives. GNU Octave is one of these. Octave is free and easy to install and the syntax is almost entirely identical to MATLAB. For today’s lab, everything you need to do will work perfectly in Octave, so we are suggesting that you download and install it from the following location:
https://www.gnu.org/software/octave/download
Scroll down to the “Microsoft Windows” section and download the first file, “octave-6.2.0-w64-installer.exe” which will install Octave on your machine.
If you can’t install Octave for some reason, these are other options you could consider:
- Use Octave Online (somewhat limited, but would be fine for today’s lab),
- Use MATLAB Online,
- Download and install MATLAB.
Whichever option you use, the steps to carry out the circuit analysis will be essentially the same.
Part 1: Calculate the current in an RL circuit
The following video demonstrates the process of using MATLAB / Octave to calculate the current in an RL circuit and then using LTspice to simulate the circuit. Although the circuit shown in the video is very similar to the one you’ll be analysing here, please note that the component values are intentionally not the same.
Apply the same type of analysis to the following circuit using Octave and LTspice.

SUBMISSION ITEM 1: Submit your m-file. Ensure the file is neat and well commented. The first comment should provide your name, the date, and briefly explain the purpose of the program.
SUBMISSION ITEM 2: Submit an LTspice screenshot showing the circuit diagram and two full cycles of the waveforms vs(t) and is(t). Make sure the simulation agrees with the results of your MATLAB/Octave analysis.
Part 2: Calculate the current in an RC circuit
Apply the same type of analysis (using Octave and LTspice) to the circuit shown below. Remember that the impedance of a capacitor is given by the following formula:


SUBMISSION ITEM 3: Submit your m-file. Ensure the file is neat and well commented. The first comment should provide your name, the date, and briefly explain the purpose of the program.
SUBMISSION ITEM 4: Submit an LTspice screenshot showing the circuit diagram and two full cycles of the waveforms vs(t) and is(t). Make sure the simulation agrees with the results of your MATLAB/Octave analysis.
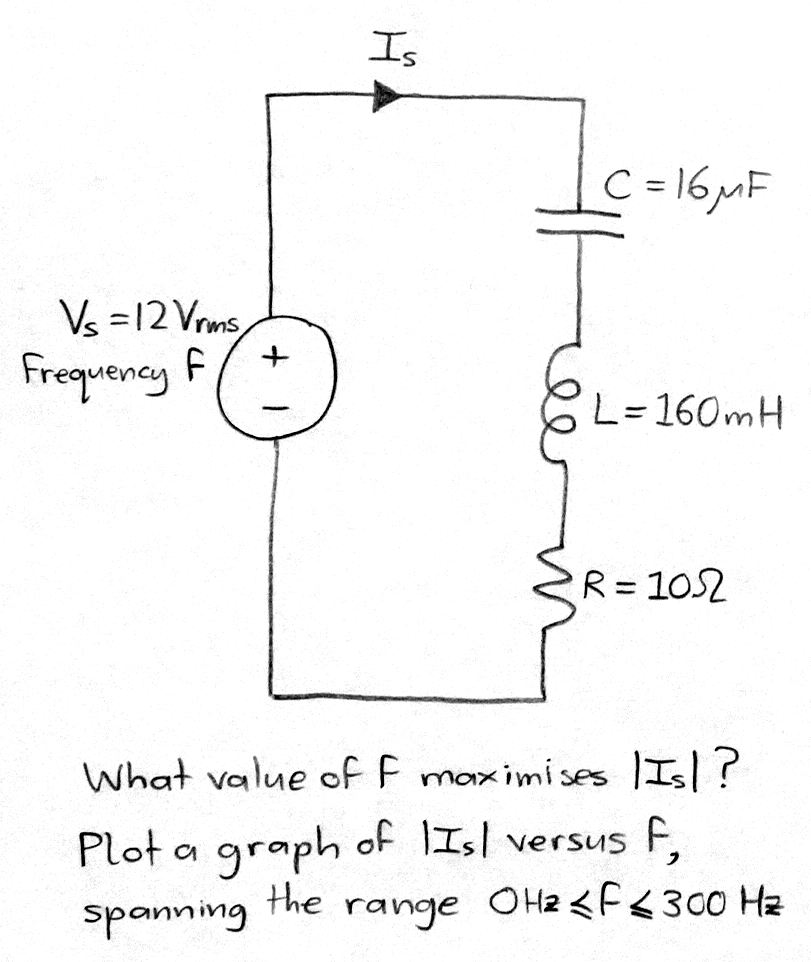
Part 3: Series resonant circuit
The impedance of the RLC circuit shown below reaches a minimum value at its so-called resonance frequency, ω0 [rad/s]. The current will therefore be at its maximum amplitude when

Write an m-file to calculate the magnitude of the current for a given frequency, f [Hz]. By running the m-file repeatedly with a different value of f each time, create a graph of current magnitude versus frequency over the range 
SUBMISSION ITEM 5: Submit your m-file. Ensure the file is neat and well commented. The first comment should provide your name, the date, and briefly explain the purpose of the program.
SUBMISSION ITEM 6: Submit a screenshot of your graph. As always, include a title, axis labels, and units for each axis.
Part 4: Power factor correction
In the circuit below, a capacitor is placed in parallel with an RL load. The resistance and inductance values are specified but the capacitance is not. With the correct capacitance value, the current phasor Is will be perfectly in phase with the supply voltage phasor Vs, which is is highly desirable because it’s more efficient to transmit electricity over long distances when the voltage and current are in phase. Hence, electricity providers provide substantial price incentives for large-scale commercial customers to keep their current in phase with the supply voltage, which (assuming an inductive load) can be achieved by installing capacitance to perform power factor correction (PFC). We will learn more about PFC in the coming weeks, but for now…
Can you figure out what value of C to include in the circuit to bring Is into phase with Vs?

Simulate the circuit in LTspice and, if you can find the correct value for C, take a screenshot showing the circuit diagram and the voltage and current waveforms in phase with each other.
SUBMISSION ITEM 7: Submit your LTspice screenshot.
