Theory
In this lab, we use what we have learned about the time constant of an RC circuit to build a capacitance measurement system. The basic principle is to construct an RC circuit using a known resistance and an unknown capacitance and then measure its time constant. The time constant, 

Hence,

In each part of this experiment, we measure the time constant by charging the capacitor to a maximum voltage and then allowing it to discharge through a resistor. The time it takes for the capacitor voltage to drop to 36.8% of its initial value is measured – this is the time constant.
For example, the diagram below illustrates what happens when a voltage source connected to an RC circuit suddenly drops from its initial value down to zero (at time t1). Assuming the voltage source had been at its initial voltage long enough for the system to settle, then the capacitor is fully charged until time t1 when it begins to discharge. The time constant provides a simple description of how fast the voltage drops towards its new resting level (0 V in this case).

In the first part of the lab, you will use the ASGO to capture a step response (of a negative-going step) and then analyse the data in Excel to find the time constant and calculate the capacitance. In parts 3 and 4, you will program the Arduino to measure the time constant automatically and print out the estimated capacitance.
In next week’s lab, you will construct your own capacitor from scratch using aluminium foil and other materials. The meter you build this week will allow you to measure the capacitance of your homemade capacitor next week.
Part 1: Measure capacitance by analysing a step response
In this part of the experiment, you will use the ASGO to capture the step response of an RC circuit and then analyse it in Excel to measure the time constant and hence obtain the capacitance. Construct the circuit shown below, using the ceramic (yellow) capacitor that is marked with the text “105M” (I won’t tell you the capacitance value, but the measurement you’re about to do should tell you what it is!).

Please note that I have rotated the MCP4911 DAC chip by 180 degrees since last week’s experiment – i.e. pin 1 of the DAC. is now in row 9 of the breadboard. You don’t need to rotate yours – I just thought it would be neater this way.

Upload the following code to the Arduino to generate a negative-going step voltage and record the response of the RC circuit.
//
// ASGO - Arduino Signal Generator and Oscilloscope
// Negative-going step response version
// Written by Ted Burke - last updated 9-Feb-2021
//
// Outputs a step waveform via a MCP4911 DAC IC, while
// simultaneously sampling the analog voltages on pins A0 and
// A1 and storing them to buffers. The input signal is generated
// for 1 second, of which the last 200 ms is recorded at a
// sampling frequency of 2 kHz. The step change occurs 20 ms
// after recording begins.
//
// To generate a step and output a frame of sampled data to the
// Serial Monitor or Serial Plotter, set the baudrate to 115200
// and then send the text command "c" or "s" (for comma- or
// space-delimited data respectively).
//

#include <SPI.h>
#define SS_PIN 10

// Modify the following 2 lines to control the step input
const float v1 = 4.0;          // voltage before step [V]
const float v2 = 0.0;          // voltage after step [V]

// Convert initial and final step voltages to ints for writing to DAC
const int v1_int = 0.2 * 1023.0 * v1;
const int v2_int = 0.2 * 1023.0 * v2;

// Sampling frequency - do not change this!
const float fs = 2000;         // sampling frequency (input and output)

// Waveform buffers
int n = 0;                     // buffer index variable
const int N = 400;             // buffer length in samples
unsigned int buffer0[N] = {0}; // buffer for input A0
unsigned int buffer1[N] = {0}; // buffer for input A1

// Variables for interaction between main loop and Timer1 ISR
volatile int countdown1000ms = 0;
volatile int countdown820ms = 0;

void setup()
{
  pinMode(SS_PIN, OUTPUT);    // Ensure that SS is set to SPI master mode
  digitalWrite(SS_PIN, HIGH); // Unselect the device

  SPI.begin();
  SPI.setBitOrder(MSBFIRST);
  SPI.setDataMode(SPI_MODE0);
  SPI.setClockDivider(SPI_CLOCK_DIV2);

  Serial.begin(115200);     // open serial connection at 115200 bits/s

  // Initialize Timer1
  noInterrupts();           // disable interrupts while configuring Timer 1
  TCCR1A = 0;
  TCCR1B = (1 << WGM12) | (1 << CS10); // CTC mode and clock prescaler set to 1
  TCNT1  = 0;               // reset Timer1 counter
  OCR1A = 8000;             // interrupt frequency is 16e6 / 8000 = 2000 Hz
  TIMSK1 |= (1 << OCIE1A);  // enable timer compare interrupt
  interrupts();             // re-enable interrupts
}

void loop()
{
  char c = 0;

  // Check for incoming text command character
  if (Serial.available() > 0) c = Serial.read();

  // Print either a space-delimited or comma-delimited data frame
  if (c == 's' || c == 'c')
  {
    // Set the initial voltage
    dac_output(v1_int);

    countdown820ms = 1640;  // count down to step time
    countdown1000ms = 2000; // count down one second of samples
    while(countdown1000ms); // let ISR handle the recording

    // Now stop recording and print buffers to PC
    for (int m=0 ; m<N ; ++m)
    {
      Serial.print(m / 2000.0, 4);
      Serial.print(c == 's' ? ' ' : ','); // either a comma or a space
      Serial.print((5.0 / 1023.0) * buffer0[(n+m)%N], 3);
      Serial.print(c == 's' ? ' ' : ',');
      Serial.println((5.0 / 1023.0) * buffer1[(n+m)%N], 3);
    }
    Serial.flush();
  }
}

//
// ** Timer1 interrupt service routine (ISR) **
// This runs once every sample period, updating the
// DAC output voltage and sampling the input voltage
// on pins A0 and A1 and storing them to buffers.
//
ISR(TIMER1_COMPA_vect)
{
  if (countdown1000ms)
  {
    // update DAC voltage to generate sinusoid
    dac_output(countdown820ms ? v1_int : v2_int);

    // store voltages from A0 and A1 to sample buffers
    n = (n+1)%N; // increment sample buffer index
    buffer0[n] = analogRead(0);
    buffer1[n] = analogRead(1);

    if (countdown820ms) --countdown820ms; // count down to step
    --countdown1000ms; // count down to end of recording
  }
}

// Write a 10-bit value to the DAC to update its output voltage
void dac_output(unsigned short data)
{
  // Construct 16-bit value (command and data bits)
  data &= 0x3ff;          // truncate data value to 10 bits
  boolean channel = 0;    // always zero for MCP4911
  boolean bufferVref = 0; // Vref input buffering disabled
  boolean gain2x = 0;     // 2x gain disabled
  boolean shdn = 0;       // output shutdown disabled
  uint16_t out = (channel << 15) | (bufferVref << 14) |
                  ((!gain2x) << 13) | (!shdn << 12) | (data << 2);

  // Transmit the 16-bit value
  digitalWrite(SS_PIN, LOW);         // select DAC chip
  SPI.transfer((out & 0xff00) >> 8); // high byte
  SPI.transfer(out & 0xff);          // low byte
  digitalWrite(SS_PIN, HIGH);        // unselect DAC chip
}
To check that the program and circuit are working correctly, open the Serial Plotter. Make sure the baudrate is set to “115200 baud”. Send the text command “c” from the send box and you should see signals like the ones below appearing in the Serial Plotter.
Close the Serial Plotter and open the Serial Monitor instead. Send the text command “c” again to capture a frame of data in CSV format. You should see data similar to the following appearing.

Copy and paste all of the data from the Serial Monitor into an Excel document, as shown below. You’ll need to scan down through the rows of data to identify the values of t1 and t2. The second Excel screenshot below shows exactly how to find t1 and t2. Once you have found both values, calculate

How to find t1 and t2:

SUBMISSION ITEM 1: Submit (to Brightspace) a screenshot of your Excel spreadsheet showing your graph and calculated capacitance value. Also submit the Excel document itself.
Part 2: Response of RC circuit to square wave input voltage
Using the same circuit as in part 1, upload the following code to the Arduino. This version of the ASGO code outputs a square wave.
//
// ASGO - Arduino Signal Generator and Oscilloscope
// Square wave version
// Written by Ted Burke - last updated 9-Feb-2021
//
// Outputs a square wave via a MCP4911 DAC IC,
// while simultaneously sampling the analog voltages on
// pins A0 and A1 and storing them to buffers.
//
// To output a frame of sampled data to the Serial Monitor or
// Serial Plotter, set the baudrate to 115200 and then send the
// text command "c" or "s" (for comma- or space-delimited data
// respectively).
//

#include <SPI.h>
#define SS_PIN 10

// Modify the following 3 lines to control the output waveform
const float dc = 2.5;          // d.c. voltage offset [V]
const float aw = 1.0;          // waveform amplitude [V]
const float fw = 10;           // waveform frequency [Hz]

// Set sampling frequency - do not change this!
const float fs = 2000;         // sampling frequency (input and output)
const float inc = fw * 2.0 * M_PI / fs;  // angle increment per sample

// Waveform buffers
int n = 0;                     // buffer index variable
const int N = 400;             // buffer length in samples
unsigned int buffer0[N] = {0}; // buffer for input A0
unsigned int buffer1[N] = {0}; // buffer for input A1

// Variables for interaction between main loop and Timer1 ISR
volatile int recording = 1;
volatile int countdown = 0;

void setup()
{
  pinMode(SS_PIN, OUTPUT);    // Ensure that SS is set to SPI master mode
  digitalWrite(SS_PIN, HIGH); // Unselect the device

  SPI.begin();
  SPI.setBitOrder(MSBFIRST);
  SPI.setDataMode(SPI_MODE0);
  SPI.setClockDivider(SPI_CLOCK_DIV2);

  Serial.begin(115200);     // open serial connection at 115200 bits/s

  // Initialize Timer1
  noInterrupts();           // disable interrupts while configuring Timer 1
  TCCR1A = 0;
  TCCR1B = (1 << WGM12) | (1 << CS10); // CTC mode and clock prescaler set to 1
  TCNT1  = 0;               // reset Timer1 counter
  OCR1A = 8000;             // interrupt frequency is 16e6 / 8000 = 2000 Hz
  TIMSK1 |= (1 << OCIE1A);  // enable timer compare interrupt
  interrupts();             // re-enable interrupts
}

void loop()
{
  char c = 0;

  // Check for incoming text command
  if (Serial.available() > 0) c = Serial.read();

  // Print either a space-delimited or comma-delimited data frame
  if (c == 's' || c == 'c')
  {
    // Count down one second of samples
    countdown = fs;
    while(countdown);

    // Now stop recording and print buffers to PC
    recording = 0;
    for (int m=0 ; m<N ; ++m)
    {
      Serial.print(m / 2000.0, 4);
      Serial.print(c == 's' ? ' ' : ',');
      Serial.print((5.0 / 1023.0) * buffer0[(n+m)%N], 3);
      Serial.print(c == 's' ? ' ' : ',');
      Serial.println((5.0 / 1023.0) * buffer1[(n+m)%N], 3);
    }
    Serial.flush();
    recording = 1;
  }
}

//
// ** Timer1 interrupt service routine (ISR) **
// This runs once every sample period, updating the
// DAC output voltage and sampling the input voltage
// on pins A0 and A1 and storing them to buffers.
//
ISR(TIMER1_COMPA_vect)
{
  static float angle = 0.0;
  float v;
  int v_int;

  if (recording)
  {
    // update DAC voltage to generate sinusoid
    angle = angle + inc; // increment phase angle
    v_int = cos(angle) > 0 ? 4 : 1;
    v_int = 0.2 * 1023.0 * v_int;
    dac_output(v_int);

    // store voltages from A0 and A1 to sample buffers
    n = (n+1)%N; // increment sample buffer index
    buffer0[n] = analogRead(0);
    buffer1[n] = analogRead(1);
  }

  if (countdown) --countdown; // decrement counter if counting down
}

// Write a 10-bit value to the DAC to update its output voltage
void dac_output(unsigned short data)
{
  // Construct 16-bit value (command and data bits)
  data &= 0x3ff;          // truncate data value to 10 bits
  boolean channel = 0;    // always zero for MCP4911
  boolean bufferVref = 0; // Vref input buffering disabled
  boolean gain2x = 0;     // 2x gain disabled
  boolean shdn = 0;       // output shutdown disabled
  uint16_t out = (channel << 15) | (bufferVref << 14) |
                  ((!gain2x) << 13) | (!shdn << 12) | (data << 2);

  // Transmit the 16-bit value
  digitalWrite(SS_PIN, LOW);         // select DAC chip
  SPI.transfer((out & 0xff00) >> 8); // high byte
  SPI.transfer(out & 0xff);          // low byte
  digitalWrite(SS_PIN, HIGH);        // unselect DAC chip
}
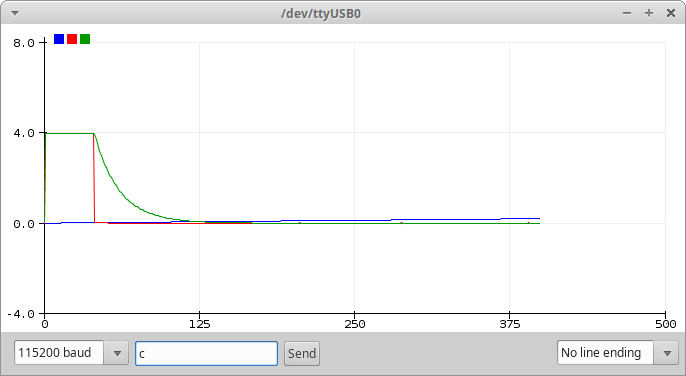
Open the Serial Plotter and send the text command “c” to display the input and output voltage waveforms. You should see a plot similar to that shown below.

SUBMISSION ITEM 2: Upload a screenshot of the Serial Plotter window showing the square-wave input voltage and corresponding output voltage exhibiting exponential decay in response to each step.
Part 3: Capacitance meter – basic version
In this part of the experiment, you will reprogram the Arduino to automatically measure the time constant and calculate the capacitance value used in the RC circuit. We begin with a basic version of the system, using the following circuit:

To begin with, you can choose any capacitor from your kit. The 100 μF electrolytic capacitor might be a good one to start with.
Note that the breadboard circuit shown below includes the MCP4911 DAC chip. However, this chip is not used in this part of the experiment. I just left mine on the breadboard for later use.

//
// EEPP Arduino capacitance meter - basic version
// Written by Ted Burke - 9-Feb-2021
//
// This system (hardware circuit and software) measures the time
// constant of an RC circuit in order to calculate the value of
// the capacitor. The unknown capacitor is placed in series with
// a 1k resistor and the time constant, tau, is measured. The
// capacitance is calculated and printed via the Serial Monitor.
//

void setup()
{
  pinMode(3, OUTPUT); // pin D3 supplies the step to the RC circuit
  Serial.begin(115200); // open serial connection
}

void loop()
{
  float tau, R, C; // time constant, resistance, capacitance
  unsigned long t1, t2;
  float Vth;

  // Charge the capacitor up to its maximum through the resistor.
  digitalWrite(3, HIGH);
  delay(2000);

  // Calculate the threshold voltage as 36.8% of the initial voltage.
  // The capacitor voltage drops to this value after one time constant.
  Vth = 0.36788 * analogRead(7);

  // Measure the time constant
  t1 = micros();              // record the start time in microseconds
  digitalWrite(3, LOW);       // begin discharging the capacitor
  while(analogRead(7) > Vth); // wait until voltage drops to Vth
  t2 = micros();              // record the end time in microseconds
  digitalWrite(3, HIGH);      // begin charging the capacitor again
  tau = (t2 - t1) * 1e-6;     // calculate the time constant (t2 - t1)

  // Calculate the resistor and capacitor values
  R = 1000.0;
  C = tau / R;

  // Display the time constant, resistance and capacitance
  Serial.print("tau=");
  Serial.print(1000*tau, 3); // milliseconds with 3 decimal places
  Serial.print(" ms, R=");
  Serial.print(R, 0);
  Serial.print(" ohm, C=");
  Serial.print(C*1e9 , 3); // nanofarads with 3 decimal places
  Serial.println(" nF");
}
To view the measured values (time constant
This basic capacitance meter works well some of the time, but has some significant flaws. For large capacitance values, such as the 1000 μF capacitor used in the screenshot below, the measured values seem reasonably accurate, but each measurement takes more than a second and displaying the value in nanofarads results in very large numbers that are difficult to read.

For smaller capacitance values, such as the 100 nF capacitor used in the screenshot below, this basic meter gives very inaccurate results. The time constant of the RC circuit is too short for the Arduino to measure accurately. One option would be to replace the 1 kΩ resistor with a much larger value and modify the program accordingly. However, this would result in extremely long measurement times for larger capacitors, which would be inconvenient. A better solution is presented in the next section.

SUBMISSION ITEM 3: Upload a photo of your breadboard circuit and the output of the system displayed in the Serial Monitor.
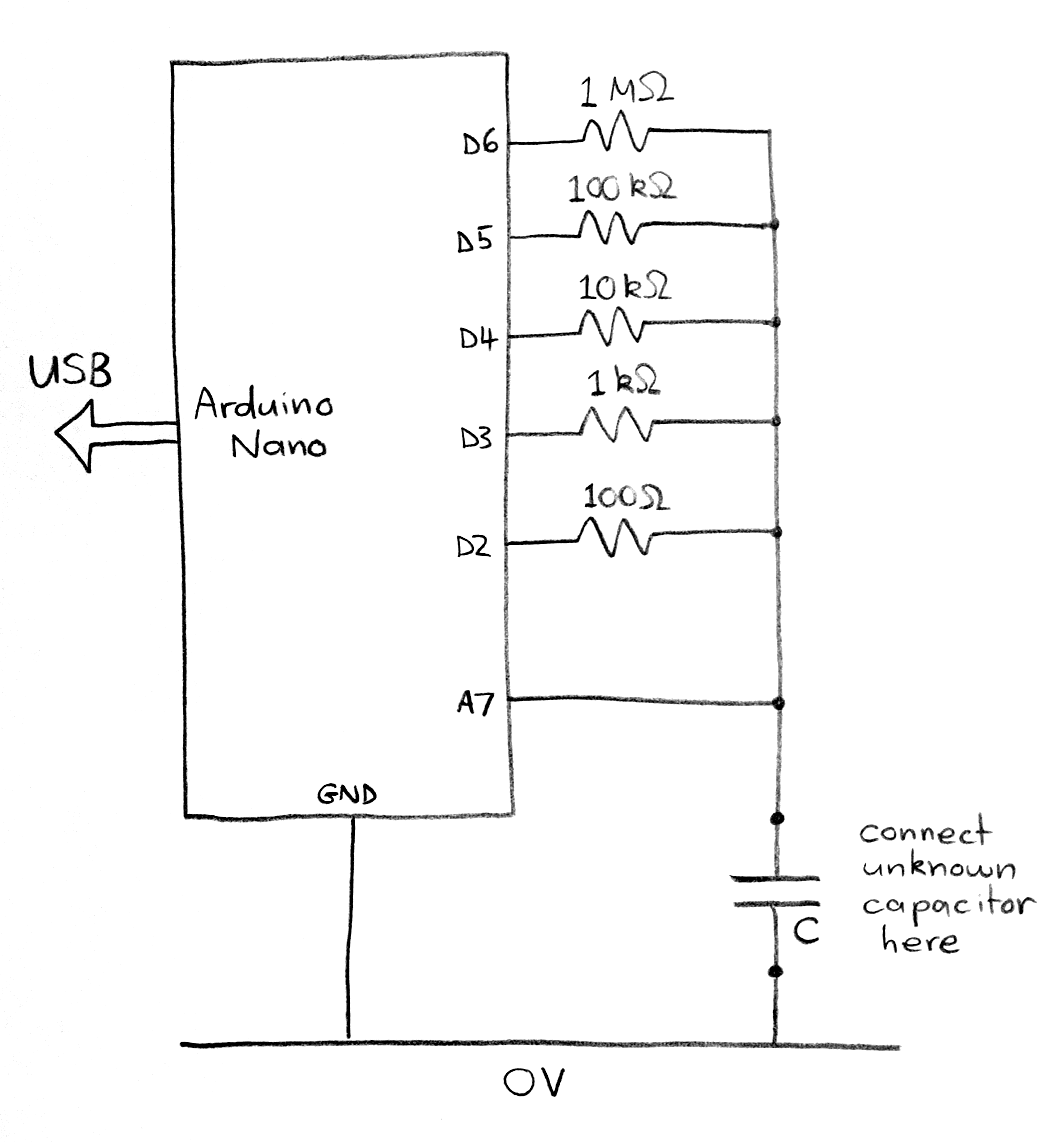
Part 4: Capacitance meter – full version
This circuit operates on the same principle as the basic version in the previous section, but five different resistor values are included, ranging from 100 Ω to 1 MΩ. When the capacitor to be measured is placed in the circuit, the system tries each resistor value in turn (starting with the smallest) until a sufficiently long time constant is obtained. The capacitance is then measured from the time constant. The result is a capacitance meter that works quite well over the range of capacitor values found in your kit.
Build the circuit shown below.

Upload the following program to your Arduino.
//
// EEPP Arduino capacitance meter - full version
// Written by Ted Burke  - 9-Feb-2021
//
// This system (hardware circuit and software) measures the time
// constant of an RC circuit in order to calculate the value of
// the capacitor. To obtain a time constant of appropriate length,
// the system has five resistor values (100, 1k, 10k, 100k, 1M),
// which are tried one at a time until a time constant longer
// than 50ms is observed, at which point the capacitance is
// calculated and printed via the Serial Monitor.
//

void setup()
{
  pinMode(2, INPUT); // disable 100 ohm resistor
  pinMode(3, INPUT); // disable 1k resistor
  pinMode(4, INPUT); // disable 10k resistor
  pinMode(5, INPUT); // disable 100k resistor
  pinMode(6, INPUT); // disable 1M resistor

  Serial.begin(115200); // open serial connection
}

void loop()
{
  int n; // resistor/pin number, e.g. R3 is 10^3 ohms and on pin D3
  float tau, R, C; // time constant, resistance, capacitance

  // Try the resistors in this order: 100, 1k, 10k, 100k, 1M.
  // The resistance used is equal to 10^n, so the value of n is
  // incremented until a time constant over 50ms is observed.
  // That time constant is then used to calculate the capacitance.
  n = 2;
  while (1)
  {
    tau = measureTimeConstant(n);
    if (tau == 0) n = 1;
    if (tau > 50e-3) break;
    if (n == 6) break;
    n++;
  }

  // Calculate the resistor and capacitor values
  R = pow(10,n);
  C = tau / R;

  // Display the time constant, resistance and capacitance
  Serial.print("tau="); Serial.print(1000*tau, 3); Serial.print(" ms, ");
  Serial.print("R="); Serial.print(R, 0); Serial.print(" ohm, ");
  Serial.print("C=");
  if      (C < 1e-9) {Serial.print(C*1e12, 3); Serial.print(" pF");}
  else if (C < 1e-6) {Serial.print(C*1e9 , 3); Serial.print(" nF");}
  else if (C < 1e-3) {Serial.print(C*1e6 , 3); Serial.print(" uF");}
  else               {Serial.print(C*1e3 , 3); Serial.print(" mF");}
  Serial.println();
}

// This function measures the time constant in seconds using resistor n.
float measureTimeConstant(int n)
{
  unsigned long t1, t2, timeout;
  float Vth;

  // Charge the capacitor up to its maximum through the 100 ohm resistor.
  pinMode(2, OUTPUT);
  digitalWrite(2, HIGH);
  delay(500);
  pinMode(2, INPUT);

  // Calculate the threshold voltage as 36.8% of the initial voltage.
  // The capacitor voltage drops to this value after one time constant.
  Vth = 0.36788 * analogRead(7);

  // Measure the time constant
  t1 = micros();              // record the start time in microseconds
  timeout = t1 + 500000L;     // set timeout limit
  pinMode(n, OUTPUT);         // enable the selected resistor
  digitalWrite(n, LOW);       // begin discharging the capacitor
  while(analogRead(7) > Vth)  // wait until voltage drops to Vth (or timeout)
    if (micros() > timeout) return 0;
  t2 = micros();              // record the end time in microseconds
  pinMode(n, INPUT);          // disable the selected resistor
  return (t2 - t1) * 1e-6;    // return the time constant (t2 - t1)
}
Open the Serial Monitor and observe how the reading change as you swap different capacitor values in and out of the circuit.

SUBMISSION ITEM 4: Upload (to Brightspace) a very clear photo of your final breadboard circuit and the output of the system in the Serial Monitor as you changed between several capacitor values.
Part 5: Planning for next week
In next week’s lab you will build your own capacitor from scratch using (probably) aluminium foil, cling film and other materials. It will basically be a parallel plate capacitor with a thin dielectric (an electrically insulating material) in the middle. Do some research online to find out how the capacitance of a parallel plate capacitor depends on its physical dimensions and the electrical properties of the materials used to construct it. You will be using the capacitance meter from part 4 of today’s experiment to measure the capacitance of your homemade capacitor.
